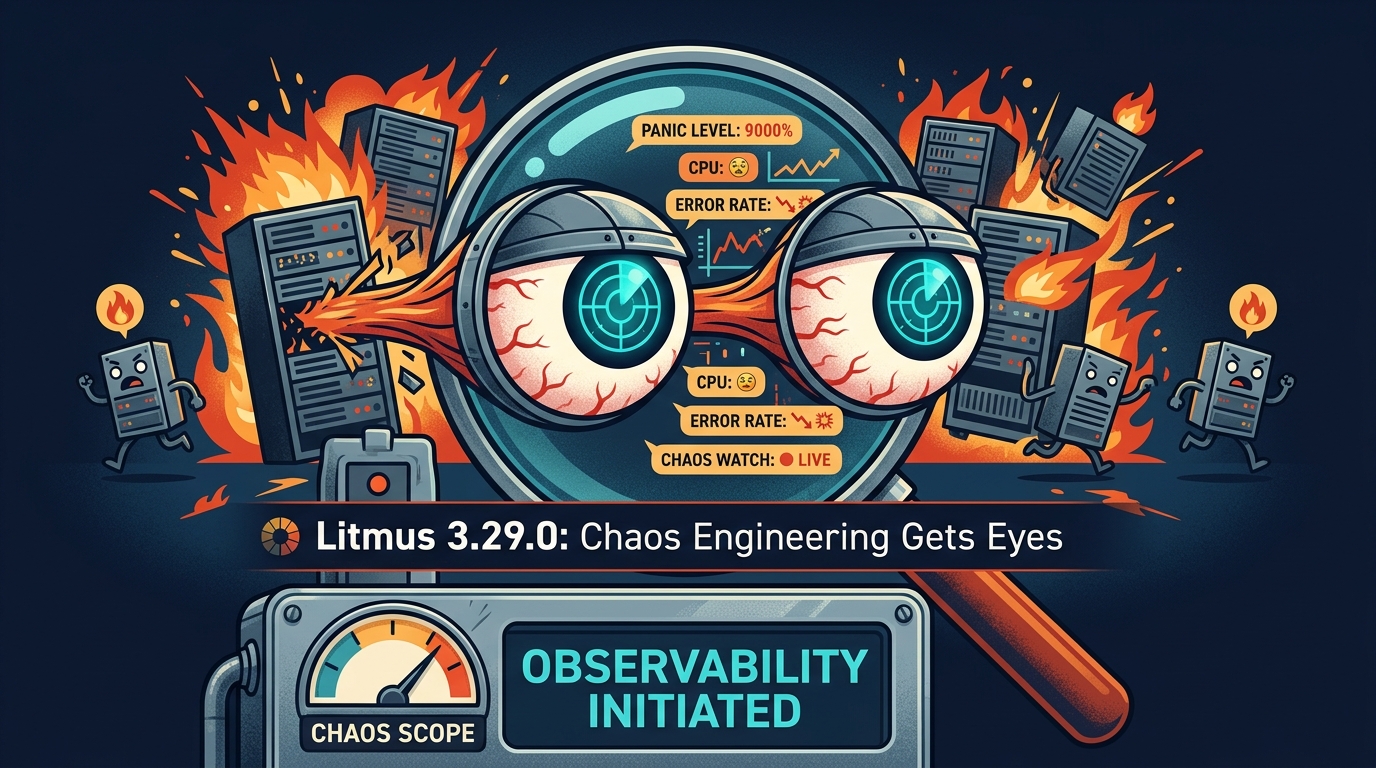

Litmus just learned how to talk to Prometheus, and your chaos experiments are finally ready for their close-up.
If you have ever run a chaos experiment and then wondered “wait, did that actually do anything?” you are going to like this one. Litmus 3.29.0 ships with native Prometheus metrics, a long-overdue fix for duplicate experiment triggers, and enough quality-of-life improvements that your on-call rotation might actually stop texting you at 3 AM.
What is Litmus?
Litmus is a CNCF incubating chaos engineering platform for Kubernetes. Think of it as a controlled way to break things on purpose so they don’t break on accident. You define chaos experiments, like “kill this pod” or “inject network latency,” and Litmus runs them against your cluster while you watch what happens.
The problem it solves: confidence. Most teams deploy software and hope for the best. Litmus lets you deliberately inject failure and measure how your system responds. It turns guesswork into evidence.
Who uses it? SREs, platform engineers, and DevOps teams who need to prove their systems can survive the things that inevitably go wrong in production. If your job title contains “reliability” or “platform,” Litmus is built for you.
Why should you care about 3.29.0? Because until now, observing your chaos experiments meant digging through logs or building custom dashboards from scratch. That era is over.
Chaos engineering without observability is like setting off fireworks with your eyes closed. Sure, you hear the boom, but did it actually light up the sky?
What’s New in Litmus 3.29.0
Prometheus Metrics: Now Your Chaos Speaks Fluent Grafana
The headline feature. Litmus now exposes native Prometheus metrics for your chaos experiments, brought to you by contributor @akhilmukkara across three focused PRs. This means you can pipe chaos experiment lifecycle events, statuses, and results straight into the Prometheus + Grafana stack you already run.
Why it matters: Before this, correlating a chaos experiment with your application metrics was a manual, error-prone process. You ran an experiment, then you switched tabs to Grafana, then you squinted at timestamps and hoped they lined up. Now, Litmus emits metrics that sit right next to your CPU, memory, and latency dashboards. The experiment is the context.
# Litmus Prometheus metrics endpoint
# Scrape config for your prometheus.yml
- job_name: 'litmus-metrics'
  scrape_interval: 15s
  static_configs:
    - targets: ['litmus-event-tracker:8080']
The team also shipped a getting started guide for Prometheus metrics (#5505) and comprehensive unit tests (#5507), so this is not a half-baked MVP. It is production-ready from day one.
Implemented in #5495.
Stop Experiments on Disconnected Infrastructure
Here is a fun scenario: your chaos experiment is running on a remote cluster, and that cluster drops off the network. In previous versions, the experiment just sat there, stuck, like a text message with no signal. Now, Litmus lets you stop experiments even when the target infrastructure is disconnected.
Why it matters: If you manage multi-cluster or edge environments, disconnected infra is a fact of life. Being able to cleanly stop a chaos experiment when the target is unreachable prevents zombie experiments from piling up in your control plane.
Fixed in #5470.
No More Duplicate Chaos Triggers
Under certain concurrent reconciliation conditions, Litmus could trigger duplicate chaos experiments. Imagine scheduling one chaos experiment and getting two for the price of one. Sounds like a deal, until you realize the second one was not planned and is now impacting a different service.
Why it matters: If you run experiments at scale with multiple concurrent workflows, this bug could cause unexpected infrastructure impact. The fix ensures that even under heavy concurrent reconciles, each experiment triggers exactly once.
Fixed in #5409.
Bug Fixes and Security
- CVE-2026-33186 (gRPC dependency bump): The gRPC library was bumped to v1.79.3 to address CVE-2026-33186. This is a dependency-level security fix. If you expose gRPC endpoints from your Litmus installation, upgrade promptly. (#5490)
- CronWorkflow run history blank page: The Chaos Center UI no longer shows a blank page when viewing run history for CronWorkflows. (#5493)
- Invalid InfraCompatibleVersions JSON: The server now returns a proper error instead of crashing silently when fed malformed version compatibility data. (#5484)
- Routing fix for project scope changes: UI routes now refresh correctly when switching projects or scopes. (#5509)
- CI and documentation fixes: SCSS module typings restored (#5482), outdated links updated (#5478), typos corrected (#5483, #5504).